One important way to measure a firm’s financial health is by calculating its Times Interest Earned Ratio. Investors use this metric when a company has a high debt burden to analyze whether a company can meet its debt obligations.
In this article, I will explain everything you need to know about this useful indicator.
What is the Times Time Interest Earned Ratio
The Times Interest Earned Ratio (TIER) compares a company’s income to its interest payments. In other words, it helps answer the question of whether the company generates enough cash to pay off its debt obligations.
A high times interest earned ratio indicates that a company has ample income to cover its debt obligations, while a low TIER ratio suggests that the company may have difficulty meeting its debt payments.
How to calculate Time Interest Earned Ratio
The ratio is calculated by dividing a company’s earnings before interest and taxes (EBIT) by its interest expenses.
Times Interest Earned Ratio = Earnings Before Interest and Taxes (EBIT) / Interest Expense
Defining EBIT
EBIT simply stands for Earnings Before Interest and Taxes. In a nutshell, it indicates the company’s total income before income taxes and interest payments are deducted.
EBIT indicates the company’s total income before income taxes and interest payments are deducted. It is used to analyze a firm’s core performance without deducting expenses that are influenced by unrelated factors (e.g. taxes and the cost of borrowing money to invest).
Usually (but not always) a company’s EBIT is equal to the “Operating Income” which is listed explicitly on their GAAP income statement. Here’s how to calculate EBIT:
EBIT = Net Income + Interest + Taxes
Defining Interest Expense
Interest expense represents the amount of money a company pays in interest on its outstanding debt. This figure can be found on a company’s income statement.
Keep in mind that not all companies have debt, and as a result, not all companies will have an interest expense. For example, this would be the case if a company is financed entirely through equity, as most early ventures or growth stage companies are.
Variations of Times Interest Earned Ratio
It’s not uncommon that practitioners will use variations of the above formula, depending on the situation. The most common variations involve:
- Use of “cash” interest expense, rather than all interest expense – helpful for situations where there’s significant non-cash interest from payment-in-kind debt (PIK) or original issue discount (OID) amortization
- Use of EBITDA, rather than EBIT – EBITDA might be used since it is a quick estimation of free cash flow available for debt paydown, given D&A is non-cash
- Use of FCF, rather than EBIT – Though not as readily accessible as EBITDA, true free cash flow (FCF) is used because it is the cash that is actually AVAILABLE for payments of interest
- 88 lessons
- 18 video hours
- Excels & templates
Time Interest Earned Ratio example
Let’s break down how EBIT is calculated by looking at a practical example. Let’s use Apple.
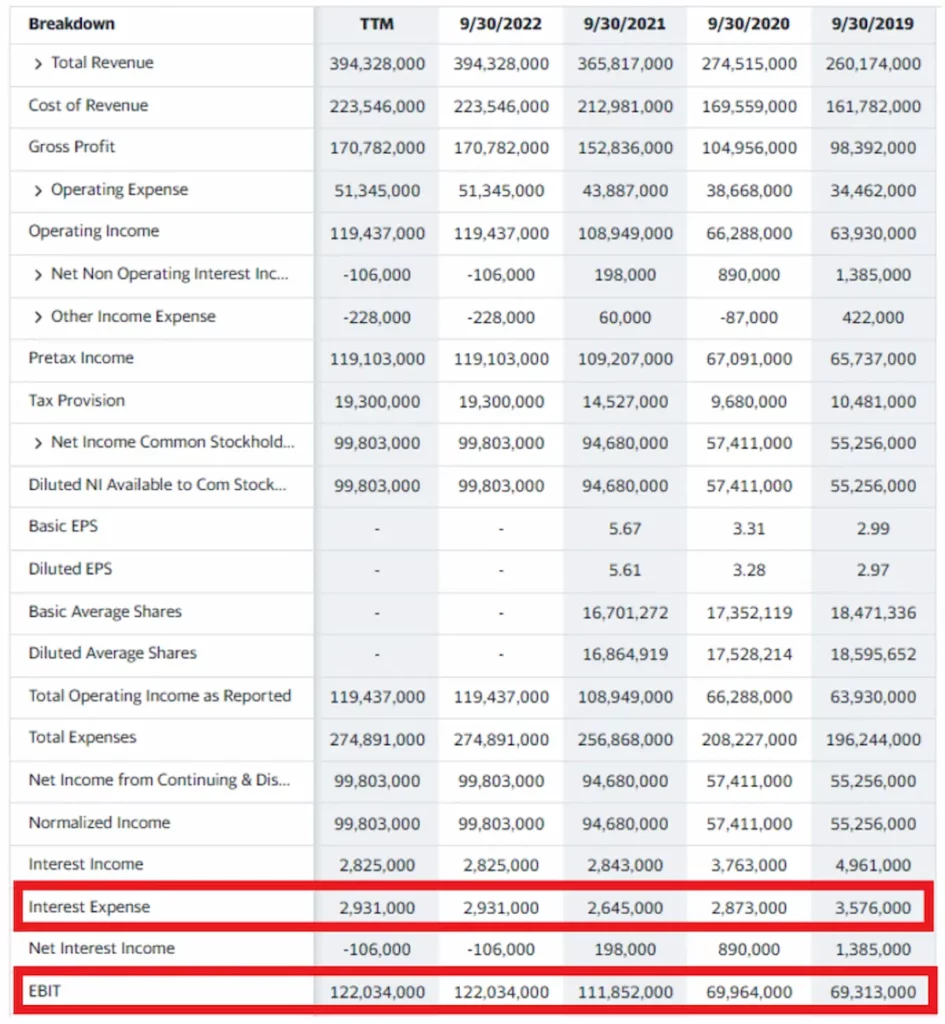
As of 9/30/2022, Apple’s EBIT is listed as being $122,034,000 (in thousands), according to Yahoo Finance:
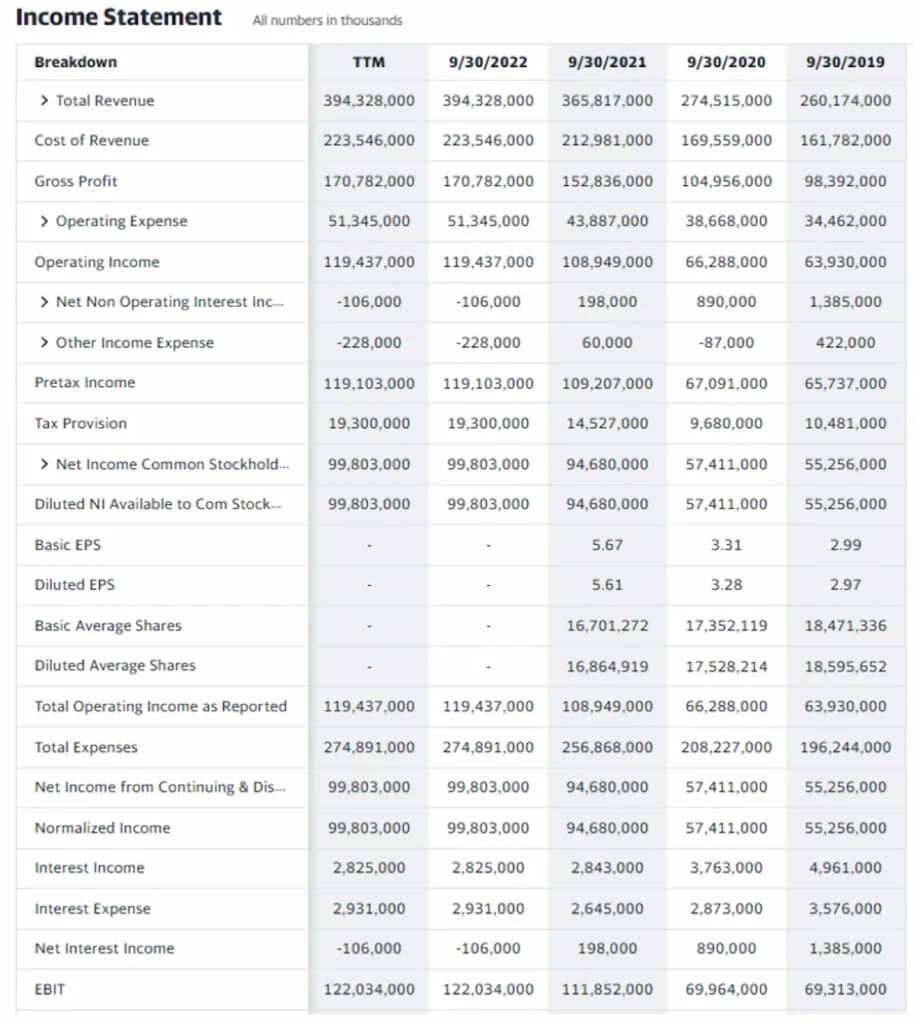
Note that Apple’s EBIT is clearly stated because we’re using Yahoo Finance. EBIT figures are not typically a GAAP reported metric, so you will likely not find it on the company’s actual financial statements.
Instead, we can find these figures on the actual Income Statement (all numbers in thousands):
- Net Income: $99,803,000
- Taxes: $19,300,000
- Interest Expenses: $2,931,000
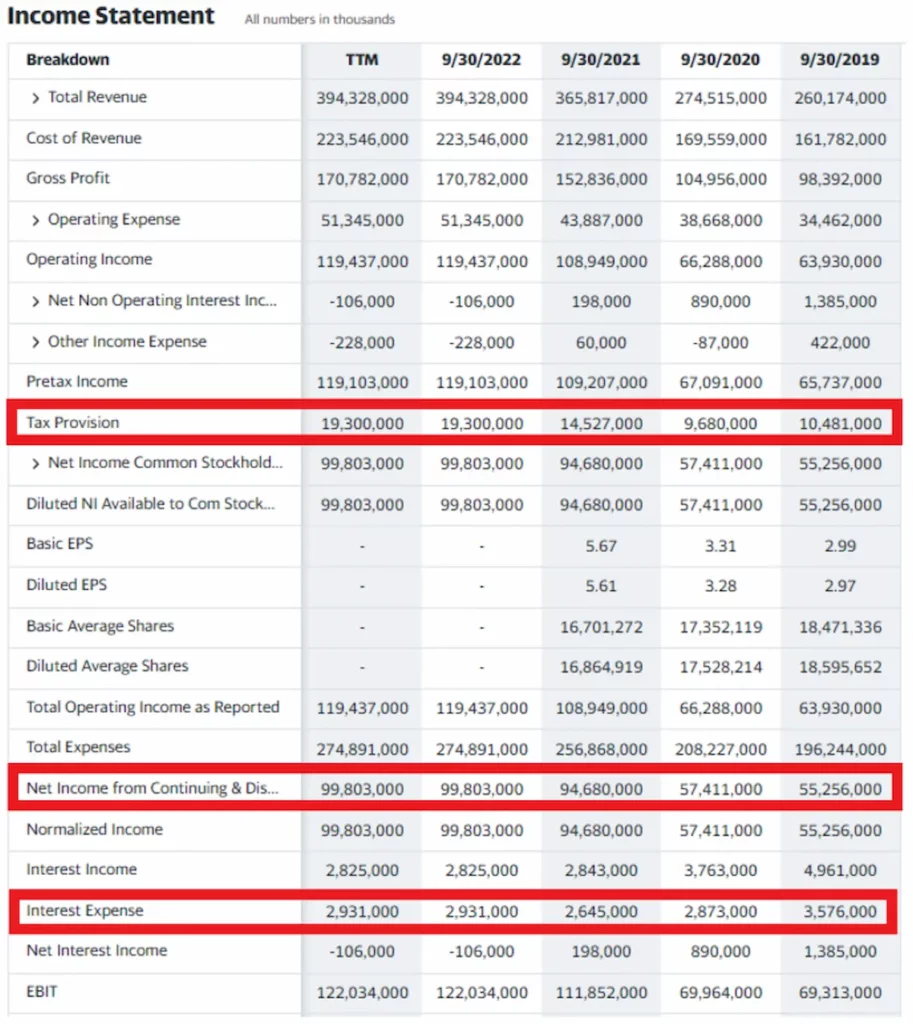
Thus, all we need to do is add up our three numbers (in thousands):
- EBIT = $99,803,000 + $19,300,000 + $2,931,000
- EBIT = $122,034,000
As you can see, our calculation matches the number that appears on the Income Statement. You can perform this calculation for any company, provided you have the Net Income, Taxes, and Interest Expenses for the year in question.
Now that we understand what EBIT is and how to calculate it, it is time to return to the core: the Times Interest Earned Ratio. Once you have all the required elements, the Times Interest Earned Ratio Formula is simple to calculate.
Once again, we turn to Apple’s Income Statement to find the numbers we need to calculate the company’s Times Interest Earned Ratio:
- EBIT = $122,034,000.
- Interest Expense = $2,931,000.
Now that we have the required numbers, we plug them into our formula:
- Times Interest Earned Ratio = 122,034,000 / 2,931,000
- Times Interest Earned Ratio = 41.6x
Times Interest Earned Ratio meaning
Based on the above calculation, Apple’s Times Interest Earned Ratio was 41.6x, as of 09/30/2022. Intuitively, this means that Apple’s profits from a single year could have covered its interest payments for that year more than 41x over!
Given that, lenders would have no worry that Apple is going to default on its interest payments. It has so much profitability in a given year that they could repay 41 years worth of interest!
How to interpret Times Interest Earned Ratio
The Times Interest Earned Ratio helps analysts and investors determine if a company generates enough income to support its debt payments.
Generally speaking, a higher Times Interest Earned Ratio is a good thing, because it suggests that the company has more than enough income to pay its interest expense. A solvent company has little risk of going bankrupt, and this is important to attract potential debt and equity investors.
- Higher Times Interest Earned Ratio – If a company has a high TIE ratio, this signifies that it is creditworthy as a borrower and has the capacity to withstand underperformance due to its ample profits and/or cash flow cushion
- Lower Times Interest Earned Ratio – A lower TIE ratio suggests that the company is at a higher risk of defaulting. Companies with inferior TIE ratios are likely to have smaller profit margins and/or more debt than their cash flows can handle.
What is a good Times Interest Earned Ratio
In theory, a Times Interest Earned Ratio of 2.5 or higher is considered acceptable, and a TIER of less than 2.5 suggests that a company’s debt burden may be too high.
There’s no strict criteria for what makes a “good” Times Interest Earned Ratio. However, many companies strive for a ratio above 2.0x. When banks are underwriting new debt issuances for LBO targets, this is often benchmark they strive for. Less aggressive underwriting might call for ratio levels of 3.0x or greater.
If a company sinks below a 1.0x Times Interest Earned Ratio, this could be considered worrisome by investors (and lenders) as it most likely points to greater underlying issues of poor profitability or excessive debt burden.
The limits of Times Interest Earned Ratio
The Times Interest Earned Ratio is useful to get a general idea of company’s ability to pay its debts. However, keep in mind that this indicator is not the only way to interpret or size a company’s debt burden (nor its ability to repay it).
When it comes to business, every industry has its own specificities. For example, well established oil and gas companies have very different capital expenditure requirements and debt structures than high growth software companies or automobile manufacturers.
Thus, while one company may seem to have a high Times Interest Earned Ratio, it may be perfectly normal given it’s industry or situation (e.g. LBO investment)
Further, indicators like the TIER, P/E, or P/B are generally used to compare similar companies to one another, rather than evaluate the intrinsic value of a standalone firm. If you are analyzing a given company, it can be useful to compare its indicators to its peers.


 Break Into Growth Equity