Leveraged buyouts (LBO) models are one of the most important analytical tools for investors and bankers to understand.
Whether you are entering the financial world in an advisory role in investment banking, or as an active investor in equity, understanding the leveraged buyout model is crucial.
The first part is understanding the mechanics of the LBO model: how it works, and what it’s designed to do. Once you understand that, we can move on to “thinking like an investor” – calculating the return on an LBO model to see whether a deal can work.
What is an LBO model?
An LBO model allows you to calculate the financial return on the acquisition of a company purchased with debt (“leverage”), usually by private equity firms. The financial return is usually calculated with IRR and multiple-on-money (MoM) from the model.
LBO models are found throughout many sectors of finance and banking. Basically, if the firm invests in businesses, or advises investors who want to buy businesses, you will run across the LBO model.
Because the LBO model is so important, it comes up frequently in investment banking and private equity interview questions. Whether you meet the LBO in its simplified paper LBO form or as a full Excel-based analysis, you will need to know the LBO model inside and out.
What does an LBO model do?
The LBO model allows equity investors and debt lenders to see if a deal can be profitable, or how profitable it can be. It can be manipulated to see if the deal is workable at different debt levels or financing structures.
In an LBO deal, the company in question is bought with majority debt financing. Because of this, the company’s earnings and cash flow are mostly used to pay off the debt.
Both equity and debt stakeholders use the LBO model to gauge whether financial return metrics (like IRR) or credit metrics (like Times Interest Earned Ratio) are adequate to approve the deal.
The full LBO model includes calculations and projected financial statements for each year that the investor or lender would be invested in the deal.
In general, you can think of an LBO model as a 3-statement financial model with a detailed debt schedule and pro forma balance sheet attached to it.
However, below is a full list of the components of an LBO model:
- Proforma capital structure – including debt structure, cost of capital, sources of debt and other capital, and debt-to-equity ratio.
- Proforma financial statements – a 3-statement model, including a balance sheet, income statement, and cash flow statement.
- Debt repayment schedule – This may be more or less complicated depending on the structure of the deal. It may be as simple as a set amount paid every period, or may include extras like excess principal payments.
- Returns analysis – This is usually based on the internal rate of return calculations on the deal, based on the free cash flow, debt paydown rate, and company growth rate. Some simpler LBO calculations may use the multiple of money (MoM) instead, which shows the return on investment, but without accounting for the time value of money like IRR.
Another easy way to remember the components of an LBO model is the acronym ASBICIR. This stands for:
- Assumptions: Start with the assumptions about the business. What will the purchase price be? What is the assumed interest rate for the debt? What is the EBITDA percentage? Etc.
- Sources and uses: How much of the deal will be financed with debt? How much equity will the sponsor put into the deal?
- Balance sheet: Create a proforma skeleton balance sheet that includes cash balance, debt and equity balance for the beginning and end of each year during the deal.
- Income statement: Create a proforma skeleton income statement for each year in the deal that includes gross income, EBITDA, interest, and taxes.
- Cash flow statement: Create a proforma skeleton statement of free cash flow that includes net income, depreciation and amortization, capital expenditures, and any change in net working capital.
- Interest: Calculate how much interest, and how much principal, was paid over the course of the LBO. The total amount paid should be roughly equal to the free cash flow, since the assumption is that the free cash flow is used almost entirely to finance the deal and build equity.
- Returns: To find the final return on the deal, you will need the exit EBITDA multiple. This gives you the final value of the company based on its final-year earnings. The end value of the company is this EBITDA-based value less the remaining debt load of the company. Comparing this to the beginning value of the company gives you the multiple of money for the deal.
This acronym has a double benefit. Not only do you remember the parts of the model, but it also gives you a basic workflow when creating a model or solving an LBO model in a private equity case study situation.
What is the difference between a DCF and an LBO?
The difference between a discounted cash flow (DCF) model and an LBO is subtle but important. They use similar metrics and calculations, but the end goals are different.
The DCF model is used to determine the value of the company itself based on its free cash flow. This does not change based on the funding sources used to buy the business. You could use a DCF model to determine a business’ value whether you were funding it with debt or equity.
The end goal of a DCF calculation is a value estimate for the business. I’ll emphasize the word estimate here – a DCF model is theoretical by nature and includes many more assumptions than an LBO does, mainly an assumed discount rate.
The LBO looks at how the free cash flow in the business can be used to cover the debt service when debt is used to finance the acquisition. In a leveraged buyout model, the main purpose of the cash flow is to cover the debt payments and gradually decrease the leverage over time. The main end goal of an LBO is to determine if the deal is workable when financed with debt. While the LBO might be calculated with different purchase prices to see if it changes the outcome, the purchase price or business valuation isn’t the main point of the LBO.
If you look around my website, you’ll find a lot of information about LBO’s and not a lot about DCF’s. There’s a reason for this: most bankers and investors prefer the LBO model. It gives them more concrete information without theoretical assumptions.
What are the three drivers of returns in an LBO?
An LBO is more than just a go/no-go analysis for a deal. It also shows how the company can bring value to its investors, and to itself, over the course of the leveraged buyout. There are three main drivers of value in an LBO deal:
- Valuation: The end goal of an LBO is to answer the question: how much more money will we have at the end of this deal than at the beginning? The quick answer to this question is the multiple of money (MoM), which compares the money invested to the end value of the company. If you’re fancy, you can use the IRR of the deal, which takes the time value of money at an estimated discount rate into account as well.
- EBITDA expansion: In most simple LBO models, the EBITDA percentage is assumed to be constant throughout the lifetime of the deal. However, if the company is growing well and is paying down debt, it is possible for the EBITDA percentage to increase – especially in SaaS companies. A more profitable company means a better company valuation, and a higher return on the LBO.
- Deleveraging: The cash flow on the business must be enough to cover both principal and interest payments, and ideally send extra to the principal as well. Deleveraging the deal reduces the risk over time, and sends more money to the equity section of the balance sheet, leading to a higher end valuation.
How to build an LBO model
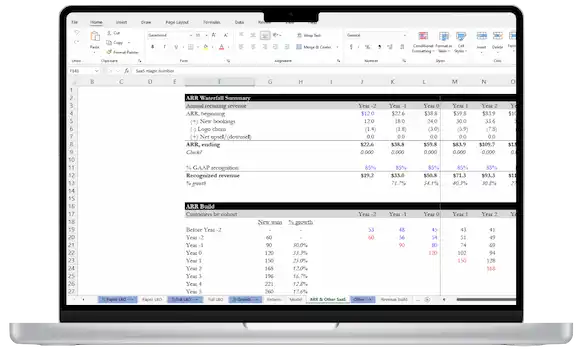
To be honest, most private equity firms and other investment professionals who regularly create LBO models have pre-built Excel templates for this.
However, if you want to understand the ins and outs of an LBO, or are practicing for a private equity interview, use the ASBICIR acronym (mentioned above).
Walk me through an LBO model
A private equity interview (or investment banking interview) could have the question “Walk me through an LBO.” When this interview question comes up, know where to start.
The first step is to create a beginning valuation for the company right now – year 0 of the deal. This creates the implied equity value of the company. If the LBO model has the assumption that it is a “pure” LBO with no cash or outside debt as part of the transaction, the equity value is also the beginning enterprise value of the deal.
In order to find the equity value, you need the entry multiple assumption from the LBO model. Depending what information you are given, multiply the entry multiple by either the last 12 months (LTM) or the next 12 months (NTM) EBITDA. This gives you the entry value for the LBO deal.
Remember the ASBICIR formula? This reminds you what comes next.
The next step is to make the sources and use tables for the deal. The sources are the places where the firm can raise capital for the acquisition – debt sources and equity sources. The uses are how the firm will use the money raised. Most of this is the buyout itself, but a small percentage is also the transaction and closing fees. Watch your assumptions carefully to be sure you don’t miss anything important – most of the deal assumptions relate to the deal financing.
Now you’re ready to get into the meat of the calculations – creating the proforma income statement, cash flow statement, and debt repayment schedule for each year of the deal.
After you have all the years of the financial statements, the final step is calculate returns based on the financial projections and debt paydown that you’ve modeled. This will lead to an ultimate IRR.
LBO Example
Below I’ll walk through a simplified example of an LBO to show you the basic mechanics.
Assumptions
- The company is valued at $100 million. This valuation is based on a $20 million EBITDA in the first year and a 5.0x entry multiple.
- Financing will be a 75/25 split between debt and equity.
- Cost of debt will be 8% interest for an 8-year term. Payments during the loan period will be interest-only, with full repayment at the end of the term.
- The EBITDA margin will stay constant over the course of the deal.
- The EBITDA growth rate will be 10% YoY.
- Depreciation and amortization is assumed to be $5 million per year.
- Capital expenditures are assumed to be 10% of sales each year.
- Operating working capital is assumed to increase by $3 million each year.
- Tax rate is 35% per year.
- Exit multiple is assumed to be the same as the entry multiple.
- Assume no transaction or financing fees
Sources & Uses:
- Sources: $75 million in debt, $25 million in sponsor equity
- Uses: $100 million in seller proceeds
Balance sheet / Income statement / Cash Flow statement:
In this simplified example, I’ll forgo the balance sheet (outside of the debt schedule – covered later).
So, the next step is to start assembling the income statement based on the information given and calculated.
- Year 1: Revenue: $100 million EBITDA: $20 million
- Year 2: Revenue: $110 million EBITDA: $22 million
- Year 3: Revenue: $121 million EBITDA: $24.2 million
- Year 4: Revenue: $133.1 million EBITDA: $26.62 million
- Year 5: Revenue: $146.4 million EBITDA: $29.3 million
- Year 6: Revenue: $161 million EBITDA: $32.2 million
Less depreciation:
- Earnings before tax year 1: $15M
- Earnings before tax year 2: $17M
- Earnings before tax year 3: $19.2M
- Earnings before tax year 4: $21.6M
- Earnings before tax year 5: $24.3M
- Earnings before tax year 6: $27.2M
Less interest:
- Earnings before tax year 1: $9M
- Earnings before tax year 2: $11M
- Earnings before tax year 3: $13.2M
- Earnings before tax year 4: $15.6M
- Earnings before tax year 5: $18.3M
- Earnings before tax year 6: $21.2M
Less taxes:
- Net income year 1: $5.75M
- Net income earnings year 2: $7.05M
- Net income earnings year 3: $8.48M
- Net income earnings year 4: $10.05M
- Net income earnings year 5: $11.8M
- Net income earnings year 6: $13.7M
Next, calculate the company’s cash flow available for debt service in years 1-5. The first step is to go from Net Income to FCF. You’ll typically do that by taking Net Income and adding back depreciation, and subtracting CapEx and changes in NWC.
Companies typically have many line items that need to be added back to net income. I won’t walk through every calculation here. But let’s assume that eventually for our company, we calculate the free cash flow is:
- FCF Year 1: $1.75M
- FCF Year 2: $2.05M
- FCF Year 3: $2.48M
- FCF Year 4: $3.05M
- FCF Year 5: $3.5M
Returns
To simplify things, we’ll add these together to get the cumulative FCF over the life of the LBO:
- Total free cash flow: $12.58M
Assume that all free cash flow will go to debt paydown over the life of the deal to reduce the debt level (and increase the equity value of the company) at exit.
Now we have the information we need to calculate the ending valuation of the company and the IRR over the life of the LBO.
We can calculate the end value of the company:
- Ending EBITDA x exit multiple: $32.2M x 5 = $161.5M
Calculate end debt level:
- Beginning debt level – free cash flow: $75M – 12.58M = $62.52M
- Note, in a full LBO model, we’d calculate the full debt schedule where debt is paid down each year out of free cash flow in that year
Calculate ending equity value:
- Ending enterprise value of the company – ending debt level: $161.5M – $62.52M = $98.98M
Calculate the multiple of money:
- Ending equity value ÷ beginning equity value: $98.98M ÷ $25M = 3.9x
Estimate the IRR based on the MoM and a 5-year timespan:
- IRR = ~32%
Conclusion
For investors and analysts, understanding the LBO model is critical. This article provided an in-depth guide to developing an LBO model, including its definition, purpose, differences from the DCF model, the three drivers of returns, a step-by-step walkthrough, an example, and a template.
For more in-depth information about the LBO model and how to prepare for a paper LBO, see the other articles in my private equity preparation series.
 Break Into Growth Equity